Aquesta web utiliza cookies tècniques, de personalització i anàlisi, pròpies i de tercers, per facilitar-li la navegació de forma anònima i analitzar estadístiques de l'ús de la web.
Considerem que, si continua navegant, n'accepta el seu ús. Obtenir més informació
i
Faune petit (Hipparchia hermione) - Pau Ortega i Colet
Itinerari situat a la Parròquia d’Encamp que representa l’estació situada a més altitud, tant pel què fa al BMSAnd com a la xarxa CBMS. Amb solament 6 seccions, té una longitud total de 2.208 metres i es troba a 2.280 metres d’alçada. S’han realitzat comptatges els anys 2007 al 2009, el 2017 i del 2019 fins a l'actualitat.
L’itinerari passa per diversos prats alpins i roquissars on hi ha presents poblacions d’espècies d’alta muntanya. Els comptatges s’inicien al maig, quan la fosa de la neu permet d’accedir a l’itinerari.
Sampling and data series
Years with data: 11 [2007-2009,2017,2019-2025] Recorded species: 81 (Annual average: 36) Recorded individuals : 5099 (Annual average: 464) Number of recording samples: 140
Climatic variables
Average annual temperature: 3 ºC Average of January minima: -6 ºC Average of July maxima: 17 ºC Annual precipitation: 1140 mm
Phenology
The bars show the weekly average butterfly abundance (calculated as the number of specimens per 1000 m) for the set of species recorded in the transect. Dots correspond to the weekly average number of species.
Habitats
The graph shows the relative cover of each habitat type in the whole transect. Since 2000, a botanical characterization has been performed for each itinerary every six years. For itineraries with more than one botanical characterization, you can change from one to another by clicking on the year of characterization.
2021
2008
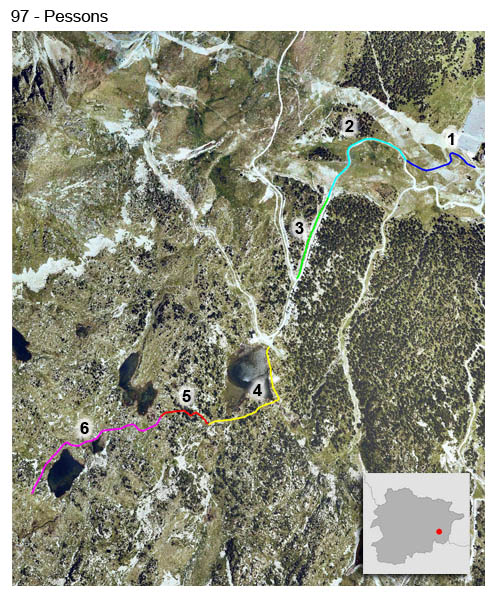
Sections
The map shows the transect route and the layout of the different sections. The background photograph corresponds to the 1:5000 orthophoto from the Cartographic Institute of Catalonia (ICGC).
Species occurring in this transect
Click to the Table to see the species list ordered by the abundance index average standardized at 100 m. Also, there is the trend each species follows in this itinerary. If you click the trend of any species you will enter Species by itinerary results. For more information about the index and trends calculation see Data analysis