Aquesta web utiliza cookies tècniques, de personalització i anàlisi, pròpies i de tercers, per facilitar-li la navegació de forma anònima i analitzar estadístiques de l'ús de la web.
Considerem que, si continua navegant, n'accepta el seu ús. Obtenir més informació
i
Daurat de punta taronja (Thymelicus sylvestris) - Pau Ortega i Colet
Itinerari de baix esforç situat al municipi homònim, a l’Alt Penedès. L'itinerari té una longitud de 1.230 metres amb un total de 10 seccions. Situat a la finca de caves Recaredo, enmig de la zona vitícola de la comarca. Està a una alçada mitjana de 431 metres i s'han fet censos des de l’any 2017 al 2024.
A Sant Quintí es fa una gestió biodinàmica de les vinyes, que pretén afavorir la biodiversitat i conservar un mosaic de paisatge tradicional, amb fragments seminaturals intercalats entre les pròpies vinyes. S'inclouen seccions en vinyes (una jove i una madura), en zones ruderals (resseguint camps de conreu i pistes), en camps d'oliveres i en ambients seminaturals (brolles, timonedes i fenassars).
Sampling and data series
Years with data: 9 [2017-2025] Recorded species: 65 (Annual average: 44) Recorded individuals : 6681 (Annual average: 835) Number of recording samples: 99
Climatic variables
Average annual temperature: 14 ºC Average of January minima: 2 ºC Average of July maxima: 29 ºC Annual precipitation: 662 mm
Phenology
The bars show the weekly average butterfly abundance (calculated as the number of specimens per 1000 m) for the set of species recorded in the transect. Dots correspond to the weekly average number of species.
Habitats
The graph shows the relative cover of each habitat type in the whole transect. Since 2000, a botanical characterization has been performed for each itinerary every six years. For itineraries with more than one botanical characterization, you can change from one to another by clicking on the year of characterization.
2023
2017
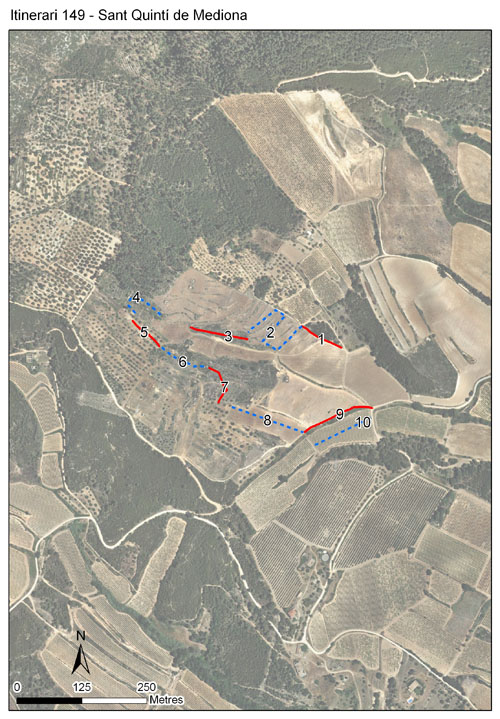
Sections
The map shows the transect route and the layout of the different sections. The background photograph corresponds to the 1:5000 orthophoto from the Cartographic Institute of Catalonia (ICGC).
Species occurring in this transect
Click to the Table to see the species list ordered by the abundance index average standardized at 100 m. Also, there is the trend each species follows in this itinerary. If you click the trend of any species you will enter Species by itinerary results. For more information about the index and trends calculation see Data analysis